

Redash
Transform your data into actionable insights with Redash's intuitive dashboards and powerful analytics capabilities for efficient decision-making.
Redash serves as a powerful tool for business intelligence, focusing on data visualization and analytics. It seamlessly integrates with various data sources, including PostgreSQL, MySQL, and MongoDB. While it does not offer a native feature for visual report generation, users can create dashboards easily using drag-and-drop functionalities and disseminate insights effectively. Additionally, the platform is particularly adept at handling smaller datasets with great efficiency.
What Is Redash?
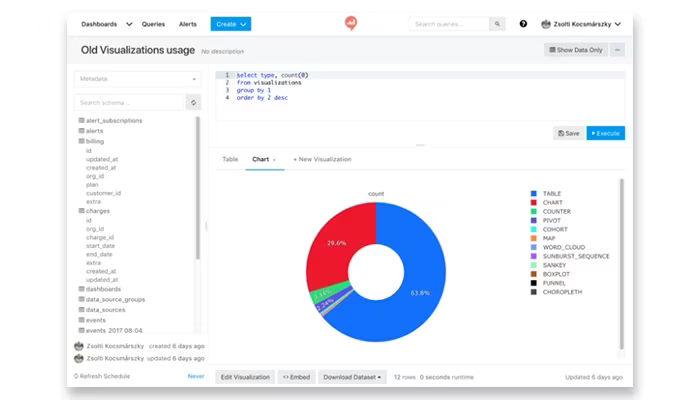
Redash is an open-source platform that facilitates collaboration for those involved in SQL-based data analysis. It offers an intuitive interface that allows users to create queries, visualize data, and share interactive dashboards. With compatibility for well-known databases such as MySQL, PostgreSQL, and Redshift, Redash enables effective querying, analysis, and visualization of data. This tool is widely adopted in the realm of business intelligence, promoting ease of access and empowering teams to make informed, data-driven decisions collectively.
What Is Redash Best For?
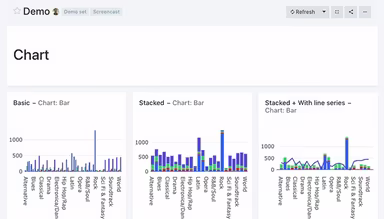
Redash excels at enabling teams to visualize and disseminate data through interactive dashboards that amalgamate information from various sources into one cohesive view. The platform accommodates numerous visualization formats, including charts, pivot tables, cohort analyses, maps, Sankey diagrams, sunbursts, and word clouds. This versatility simplifies the exploration and presentation of complex datasets for organizations. Moreover, its capabilities for sharing dashboards and embedding insights allow teams to distribute real-time information via direct links or embedded widgets for collaboration across departments and with external partners.
How Much Does Redash Cost?
The pricing for Redash starts at $20 per user per month and can go up to $120 per user per month. This pricing structure is informed by industry standards for business intelligence and analytics solutions that provide features such as dashboard creation, SQL querying, data visualization, and collaborative reporting.
Organizations should also consider the following potential costs:
Implementation: Ranges from $500 to $5,000 for startups and SMBs; $5,000 to over $25,000 for complex deployments in mid-market or enterprise settings.
Cloud Infrastructure And Hosting: Costs between $50 to over $500 monthly depending on server resources, storage needs, and query workloads.
Data Source Integrations And API Configuration: Estimated between $1,000 and $10,000 based on the complexity and number of integrations.
Dashboard Development And Query Optimization: Costs can range from $1,000 to $15,000 depending on customization needs and analytics complexity.
Admin Training And User Onboarding: Expected costs are between $500 and $5,000.
Enterprise Support Or Managed Hosting Services: Typically ranges from $500 to over $5,000 monthly for organizations requiring SLAs or dedicated support.
For a detailed estimate of Redash costs tailored to your organization, reach out for assistance.
Disclaimer: Pricing is based on publicly available third-party information and industry benchmarks. Actual expenses may differ.
Redash Integrations
This software seamlessly integrates with a variety of third-party applications and platforms such as:
Google Analytics
Jira software
JSON
Python
Salesforce Engage software
Amazon Athena
Databricks
Druid
Hive software
Greenplum
How Does Redash Work?
Accessing Redash begins with logging into a centralized platform designed for querying, visualizing, and sharing business data. To effectively navigate its primary features and reporting capabilities, follow these steps:
Connect databases, APIs, cloud services, along with other supported data sources to streamline reporting and analytics tasks.
Create SQL queries using the built-in query editor equipped with features like schema browsing, auto-complete options, reusable snippets, and collaborative editing functionalities.
Merging data from different sources allows you to analyze information across various systems within a single workspace.
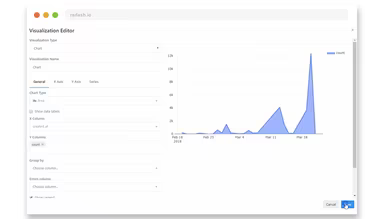
Transform query results into visual formats such as charts, pivot tables, cohort analyses, maps, Sankey diagrams, counters, and word clouds.
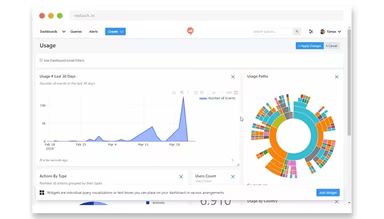
Create interactive dashboards by organizing visualizations into shareable reports that deliver real-time insights for teams and stakeholders.
Set up automatic refreshes for dashboards and configure alerts to keep track of essential metrics and changes in your data.
Easily share dashboards via secure URLs or embed widgets within websites and internal tools to facilitate collaboration and contextual reporting.
If you're interested in exploring more about its features and functionality, take a look at the Redash demo.
Who Is Redash For?
The design of Redash caters to a diverse range of business professionals including:
Data analysts
Data scientists
Business intelligence experts
Marketing specialists
Redash Use Cases
An analysis of Redash’s capabilities reveals key scenarios where this platform is often utilized for data analytics, reporting, and business intelligence:
Marketplace And Platform Businesses Tracking Operational Performance: Businesses operating in marketplaces or platforms with substantial transactional volumes can leverage Redash effectively. They typically centralize data from various systems using the platform to create dashboards that highlight critical metrics like bookings and revenue performance. The ability to execute SQL queries on live data enables teams to monitor performance in real time while supporting quicker decision-making processes across different departments.
Media And Content Platforms Optimizing Performance And Audience Insights: Organizations focused on media production or content management often manage extensive datasets related to production output and audience engagement. By consolidating fragmented data from multiple sources into unified dashboards with Redash's capabilities for SQL-based queries, these teams can analyze performance trends efficiently while tracking engagement metrics across channels. This approach aids in expediting decision-making processes across editorial and commercial teams based on solid insights.
Logistics And Marketplace Platforms Improving Operational Visibility: For logistics firms or marketplace-driven businesses with diverse operations relying on multiple data sources, Redash proves beneficial. These organizations utilize it to centralize operational data while monitoring key performance indicators such as transactions and system activity. By enabling real-time visualizations through SQL querying capabilities within the platform, teams can quickly derive insights that enhance operational transparency.
Engineering And Infrastructure Teams Monitoring System Performance: Engineering groups leveraging Redash can effectively centralize system-level metrics like logs or infrastructure costs. The platform facilitates SQL-based querying of backend systems allowing technical metrics to be transformed into actionable dashboards. This functionality helps teams maintain oversight on system health while identifying performance issues swiftly.
Is Redash Right For You?
If you’re seeking a robust Business Intelligence tool with extensive integration possibilities, Redash stands out as an excellent choice. It connects effortlessly to Data Warehouses while supporting SQL queries for visualization purposes. The tool simplifies dashboard sharing processes significantly while fostering collaboration among team members through democratized access to data insights.
This vendor is trusted by numerous prominent brands including Atlassian, Sentry, Cloudflare, and SoundCloud—underscoring its reliability within the market.
If you have any uncertainties regarding whether Redash is suitable for your needs, please reach out to our team at info@softwareseekers.com for expert assistance with your inquiries.